We’re in the middle of rebuilding our implementation of Google Analytics from the ground up. We’re working with Search Discovery as our consultants, diving heavily into Google Tag Manager, and I’m quite happy with what we’ve accomplished together so far.
I want to take a look at a situation where we recently needed insights from our Google Analytics data, and talk about why we weren’t able to get the data we wanted. It makes good case for what we’re changing and why.
Background
Until the User Experience department was formed in 2012, nobody on our staff had primary responsibility for Google Analytics. As a result, our implementation grew organically and without strategic guidance.
I want to emphasize upfront that this was nobody’s fault – we just never had anyone whose job involved ownership (which is very different from implementation) of Google Analytics. Some staff managed access and others pulled stats, but we never looked strategically at what we were tracking, how, and why.
If someone wanted to implement analytics on a project, they just did it – often with their own brand new account. We started using Google Analytics in early 2011. By late 2015 our stats were spread across 7 Google Analytics Accounts, more than 20 GA Properties, and more than 75 GA Views.
It took us a couple years after our department’s creation to get a handle on how everything was set up and what insights we could pull from it. Recently we decided we were ready to rebuild.
The Symptoms
One of our big projects right now is migrating our e-resource links from a home-grown management system into LibGuides. We have more than 1400 e-resources, so it’s a complicated process. I won’t go into all the details here, but along the way we wanted to know one central piece of information:
How do users get to our e-resources?
We have links to them on an e-resources webpage, records for e-resources in the catalog, the “Best Bets” suggestions that pop up on some of our combined search result pages, and some other smaller points of access.
After a couple dozen staff hours synthesizing data from Google Analytics, we were only partially able to answer this question.
The Problems
Fractured Tracking Codes
Because our GA implementation was spread among multiple accounts, we couldn’t look at this question holistically. We had to pull reports from least three different accounts and do manual de-duplication. For example, stats from our main website (library.unc.edu), our catalog (search.lib.unc.edu), and our current e-resources management system (eresources.lib.unc.edu/eid/) are all kept in separate accounts. We have no way to track a user’s complete journey across all of those sites.
Lack of Event Tracking
By default, Google Analytics doesn’t track clicks to external links. Clicks from our website to any 3rd party site simply weren’t logged. And E-resources, by their nature, are 3rd party sites. You can fix this with event tracking, but you have to set it up ahead of time. You can’t retroactively generate this data.
We set up some event tracking over the years, and it was helpful but not comprehensive enough. Planning the Events to track should be done strategically. We were working reactively instead of planning ahead.
Tracking Duplicate Links Together
In some situations we have two links to an e-resource on the same page. You can see this with our Best Bets search results. Certain search terms produce suggested links, plus the regular search results further down.
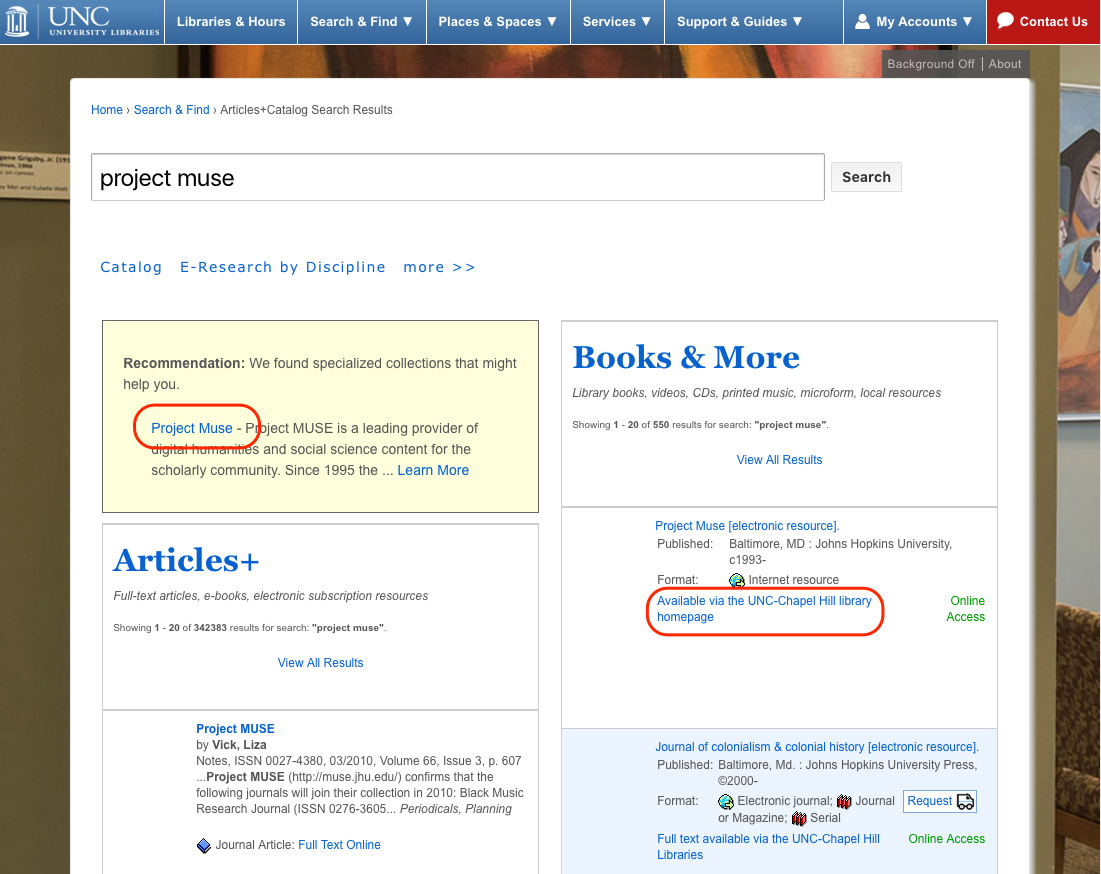
In this case (see it live), we did have event tracking set up. But we hadn’t thought about one important detail – to Google Analytics, both of those circled links are the same. They point to the same URL. We could see a collective number for how many clicks an e-resource got on this page, but not which clicks came from each link. Without this differentiation, we couldn’t judge the effectiveness of Best Bets as a discovery source for our e-resources.
You can configure Event tracking to work around this situation, but again have to do it in advance.
Fixing Our Analytics
How we configured our new and improved Google Analytics implementation is a post or talk for another time. (Or come hear us talk about it next week at the TRLN Annual Meeting!)
Our biggest change is switching to Google Tag Manager to implement our Google Analytics tracking code. It lets us do event tracking and other advanced configuration in a much more streamlined, programatic way. Our new data just started rolling in yesterday, and it looks so much better!
Carrying On
The e-resources migration project has to be done by the start of Fall semester. It can’t wait for our new and improved stats to build up. Thankfully we had other sources of data to draw on – Sarah Arnold recently completed usability testing of our current e-resources system and interviewed faculty and grad students. We also did some quick general usability tests in May that had relevant outcomes, and got some limited insights from our old Google Analytics configuration.
By drawing on all these sources we were able to gain some insight into how our users get to our e-resources, but not quite as fine-grained as we hoped. It was enough to inform what I feel are good decisions, but it took far longer and with more stress than I wish were necessary.
In a way, the timing of the e-resources migration project is perfect. It highlights clearly just how important robust stats are to our decision-making process and just what the impact is when they don’t meet our expectations. I am so excited by the work we’re doing with Search Discovery this summer, and can’t wait to empower our staff with the stats they need to support their decision-making in the future.