When UNC made the decision to move classes online in March 2020, the services desks at the Libraries were no longer an option for patrons to visit with their questions. This project looks into how patrons used the library chat services differently after the transition to remote learning.
Reference chat transcripts are stored on a service called LibraryH3lp, which also allows those with access to tag chats manually and pull statistics on usage patterns. I will compare chat statistics from April 2019 to April 2020 (the first full month of remote instruction at UNC) to see what differences there were in usage statistics and types of questions asked.
This analysis was guided by a series of questions that get into the specific details of how chat usage may have changed. First, I will compare the monthly usage trends from 2019 to 2020 thus far. Then, in terms of more specific usage statistics, I will address how peak usage hours shifted, how chat durations changed, how channel usage shifted, and how users found the chats.
How does 2020’s monthly usage trends compare to those from 2019?
The graph below compares the usage per month of library chats in 2019 and 2020.
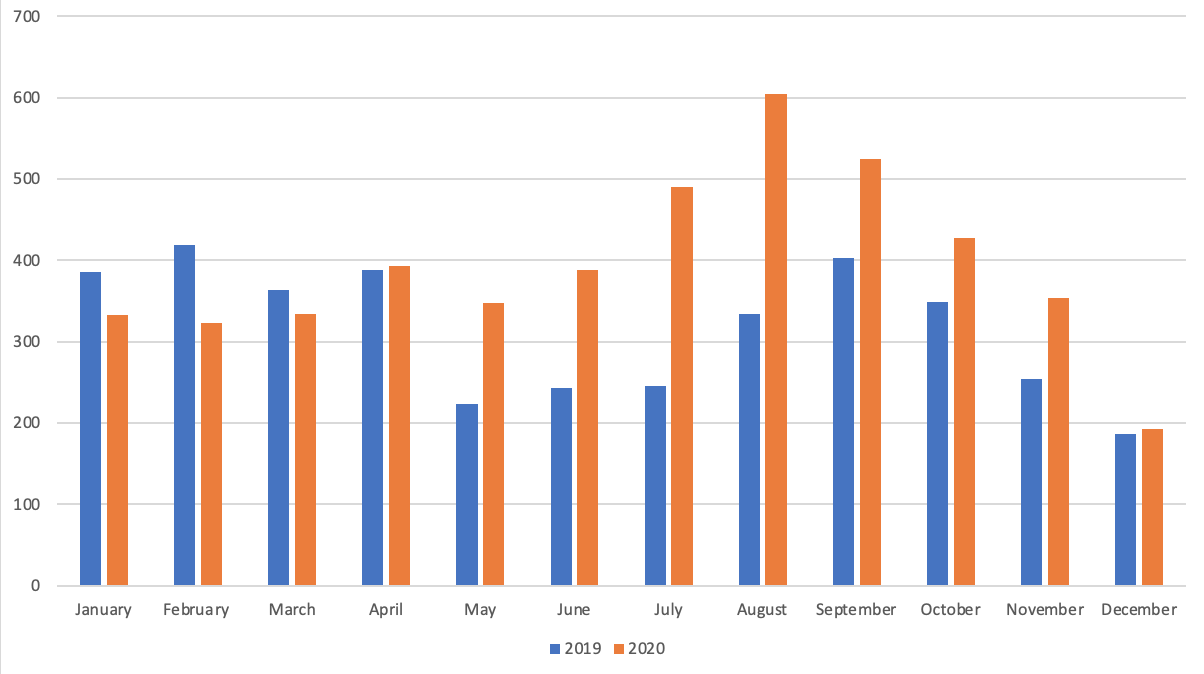
Figure 1 above depicts different trends in the usage- the spring semester of 2020 saw less usage overall than the spring semester of 2019. While the scale is significantly different between the two years (highest month of usage was roughly 400 in 2019 and roughly 550 in 2020), the trends differed in the spring and remained roughly the same in the fall. In the spring semesters, the usage started out steady from month to month, but the drop-off in chat usage that happened in May 2019 was not replicated in May 2020. The fall semesters followed the same trend of increasing in the middle of the semester and tapering down as the semester ends.
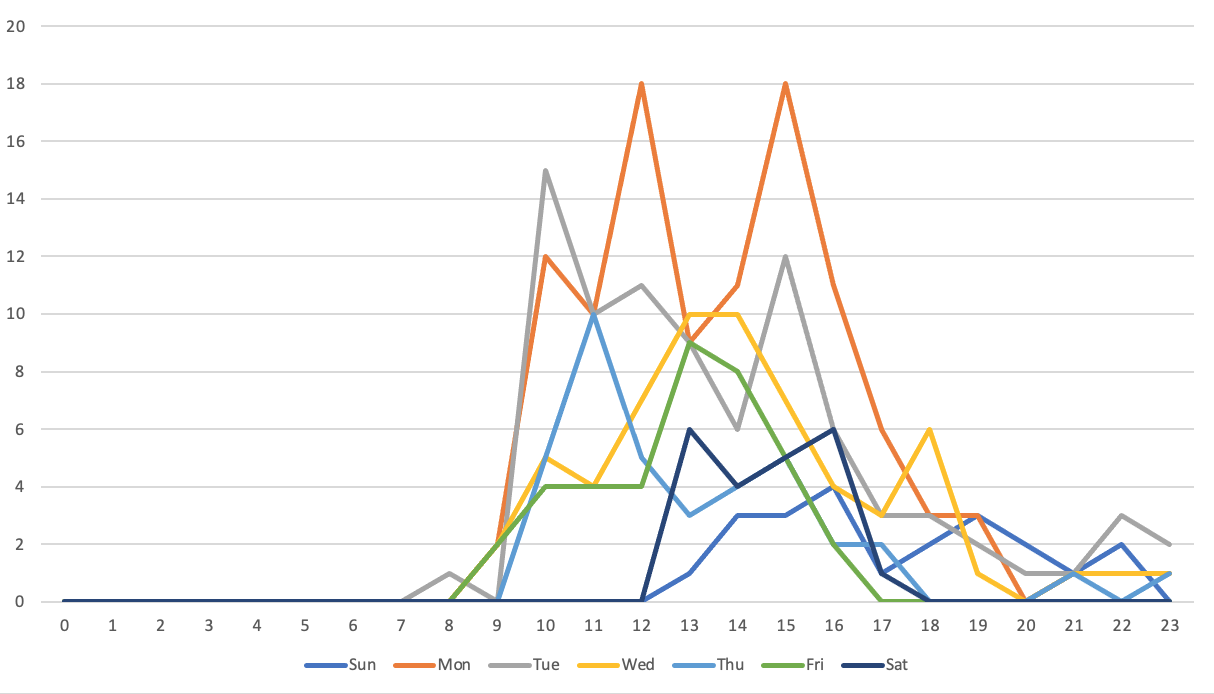
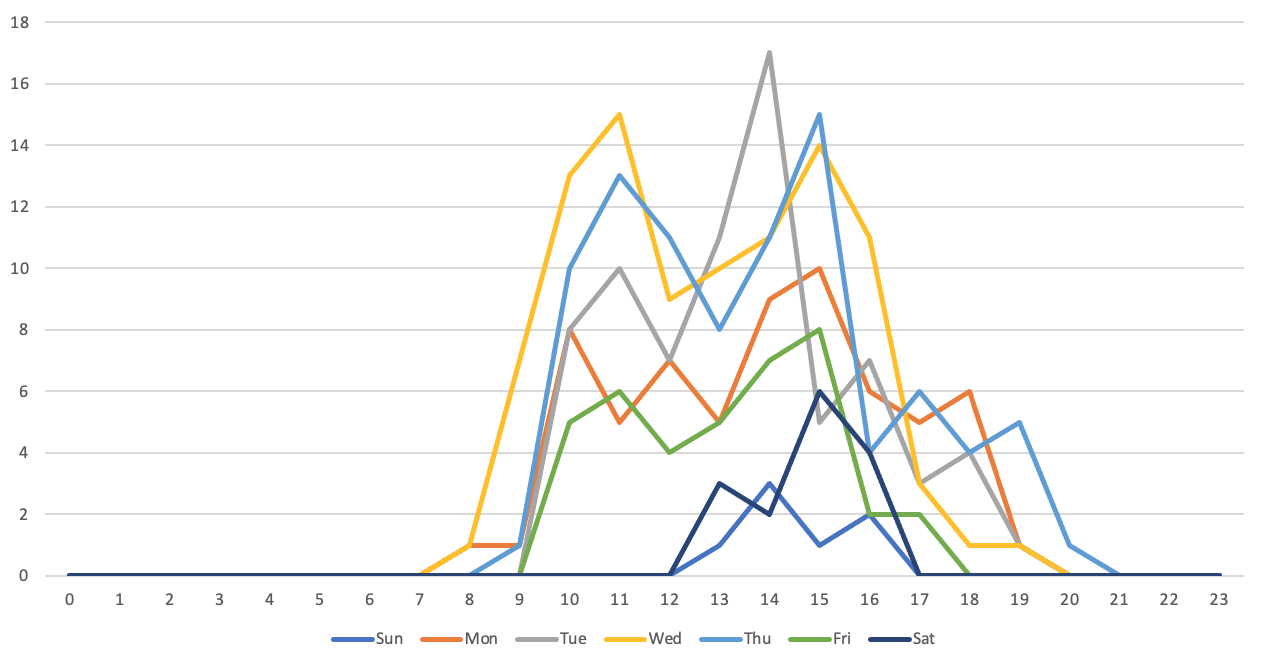
Have peak usage hours shifted?
I present below two graphs – one from April 2019 and one from April 2020 – that depict the chat usage per hour across different days of the week.
Have the chat durations changed?
I present Table 1 below to address chat durations:
Table 1: Chat Durations
| April 2019 | April 2020 | |
| Average duration | 0:10:24 | 0:11:07 |
| Max duration | 1:27:52 | 2:00:53 |
| Min duration | 0:00:01 | 0:00:01 |
| Median duration | 0:00:28 | 0:08:03 |
| Total duration | 67:15:50 | 73:30:24 |
Table 1 demonstrates that there was not much change between the average or total chat durations across months, but there was a notable increase in median duration. April 2019 saw several chats that wherein the patron dropped out of the chat before receiving help with their question, which is why the median duration in of chats in April 2019 is so low. On the whole, though, these statistics give the impression that chat durations have not changed significantly between April 2019 and April 2020.
Has channel usage shifted?
To address this question, I present the following graph, which compares the usage of different channels:
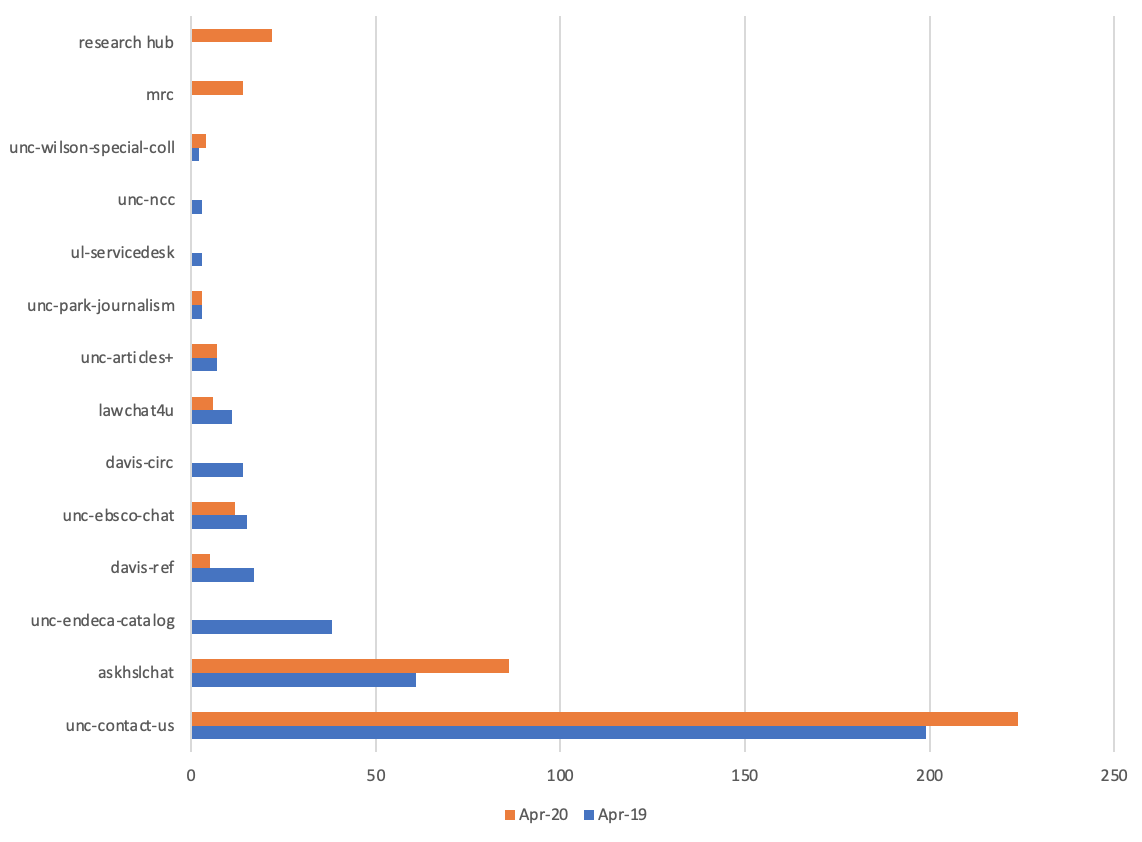
Figure 4 shows that overall, the trends seem to be the same. Some notable differences here are because of differences in which chat channels existed. On one hand, UNC-Endeca-Catalog channel was disabled between April 2019 and April 2020, and the UNC-NCC channel did not disappear, but has always had low traffic. There was no usage of UL-ServiceDesk and Davis-Circ channels in April 2020 because these chats are staffed by people working at physical service points in these buildings, which were closed at the time and unable to receive chats. On the other hand, the MRC and Research Hub channels had no usage in April 2019, and both of these were disabled for a while and enabled again in the spring of 2020. The takeaway is that most traffic is consistently coming in from the UNC-Contact-Us and AskHSLChat channels in April 2019 and April 2020.
How are users finding the chats?
To answer this question, LibraryH3lp encodes each transcript with the referrer link. Some of the referrer links were undetectable by LibraryH3lp, potentially because these users may have been browsing on private mode or have used a bookmarked URL. Some of these referrers are specific pages and others are a general category of page, such as “Catalog search pages (various),” which includes any search result page.
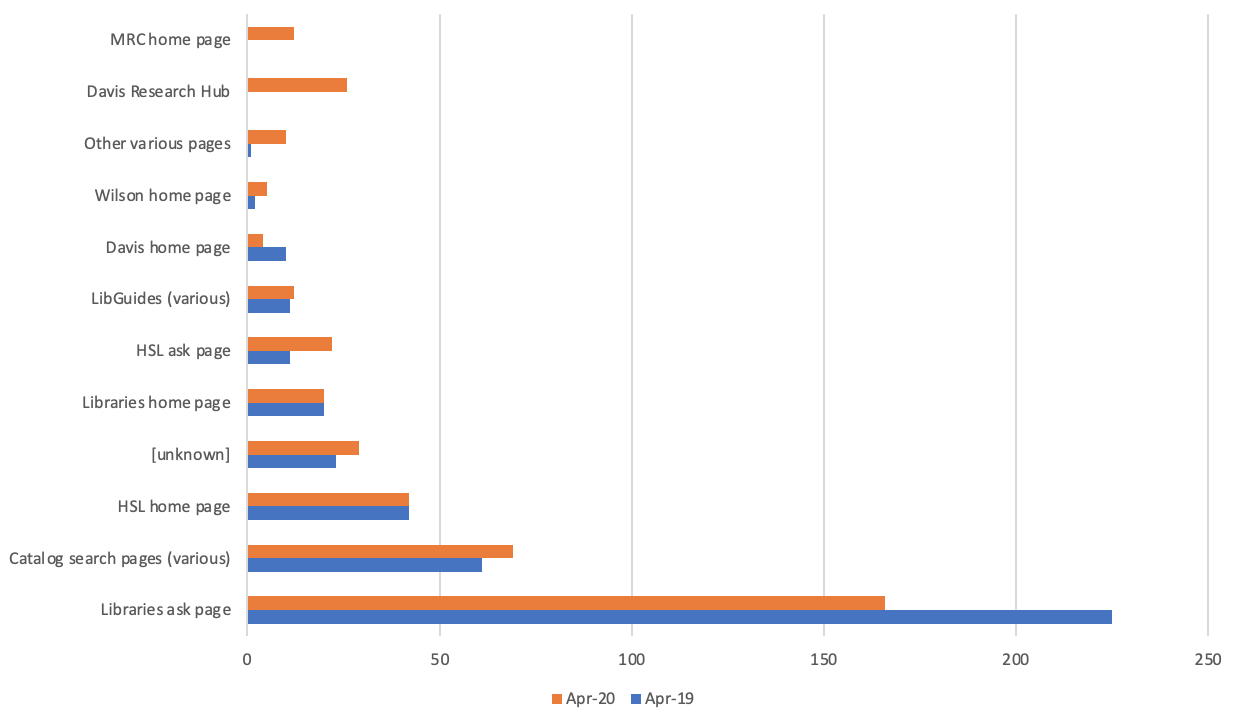
Figure 5 suggests that the majority of users in both April 2019 and April 2020 were coming from the Libraries ask page in both months. The second highest referrer for chat users was a search result page from the catalog, which indicates that these users are coming to the chat after having made a search themselves.
Additionally, in April 2019, other significant refers were the HSL page, a catalog search page, and the library home page. These were generally the most popular referrers in April 2020 as well, in addition to the Davis Research Hub page and MRC page. The Davis Research Hub page was newly moved to this URL in January 2019, so there was little traffic to it in April 2019. The MRC page, however, existed in 2019, it did not have a chat widget on it until sometime after April 2019.
What kinds of questions are users asking?
To analyze the content of the library chat questions that patrons were asking, I read through all the chats from April 2019 and April 2020 and tagged them manually. I calculated percentages of all the chats from that month that had certain attributes, such as “about policies” or “involves transfer.” I only marked chats as having been answered if there was an explicit answer and an acknowledgement from the patron that they received the answer, such as a message of thanks. I marked chats as involving transfers when there was an explicit transfer to another chat channel or when the person answering the chat answered by referring the patron to another person’s email or another part of the library. Table 2 shows the results of my tagging.
Table 2: Types of Questions Asked
| TAGS | APRIL 2019 | APRIL 2020 |
| About a particular resource | 114 (28%) | 145 (35%) |
| About general research | 97 (24%) | 110 (26%) |
| About policies | 68 (17%) | 48 (12%) |
| About spaces | 29 (7%) | 3 (1%) |
| About accounts | 39 (10%) | 26 (6%) |
| About eResources | 31 (8%) | 71 (17%) |
| Explicitly answered | 271 (67%) | 266 (64%) |
| Involved transfer | 56 (14%) | 69 (17%) |
Table 2 demonstrates that there were similar trends in types of questions asked both times, with the following differences:
- An increase in questions about particular resources (a single article, book, video, etc. that the patron had in mind)
- A decline in questions about policies and physical spaces
- An increase in questions about electronic resources or subscription services, such as PubMed or EbscoHost.
These trends more or less align with what I had expected, since the move to remote instruction would result in more patrons making use of electronic resources and possibly asking fewer questions about spaces and policies. I was surprised by the increase in questions about particular resources in 2020, but perhaps this is a result of the loss of physical service points where patrons would ask these questions of library staff. This is also related to the large portion of chat users who came from a catalog search result page, as we saw in the previous section. Perhaps these users try to search for their particular resource themselves before asking the chat for help.
A note I made while reading through these transcripts is that in April 2020, there was a high percentage of questions specifically about returning physical books that received differing answers, even on the same day. Some people said to mail the books, some said to hold them until further notice, and some said that there was a drop box open on campus. This indicates to me that there could be better communication among library employees in future remote-learning scenarios about policies of this sort.
Overall, the main changes that the chat services have seen in the month after the transition to remote learning include:
- Less use in the evenings
- More use on Wednesdays
- Less use on Mondays
- Higher traffic overall
- More questions about finding particular resources
- More questions asking for help with electronic resources or subscription services
We can’t say for sure which of these changes is a direct result of the remote learning and which are normal fluctuations in resource use. As more of UNC’s resources open back up again, this data is likely to change month-to-month and is certainly not predictive of what future semesters hold, but it is a good indicator of which factors in users’ chat behavior are likely to be consistent in future semesters and which are likely to change.